For three decades, U.S.-China trade expanded from a modest $20 billion in 1990 to a record $718 billion in 2023, creating one of the world’s most consequential trading relationships. That era of deepening integration has now entered a sharp reversal. By Q2 2026, bilateral trade had fallen to roughly $376 billion, while the U.S. goods trade deficit with China had dropped to its lowest level in decades.
Yet the decline in the China deficit has not translated into a comparable reduction in the overall U.S. trade deficit. Instead, much of the imbalance has shifted toward other trading partners. Since 2018, the U.S. deficit with China has fallen sharply while the deficit with the rest of the world has widened, reflecting a broader reconfiguration of U.S. supply chains and trade flows.
The charts below trace this transformation—from the rise of U.S.-China trade to its recent contraction, and from China’s growing role in the U.S. trade deficit to the emergence of alternative global suppliers.
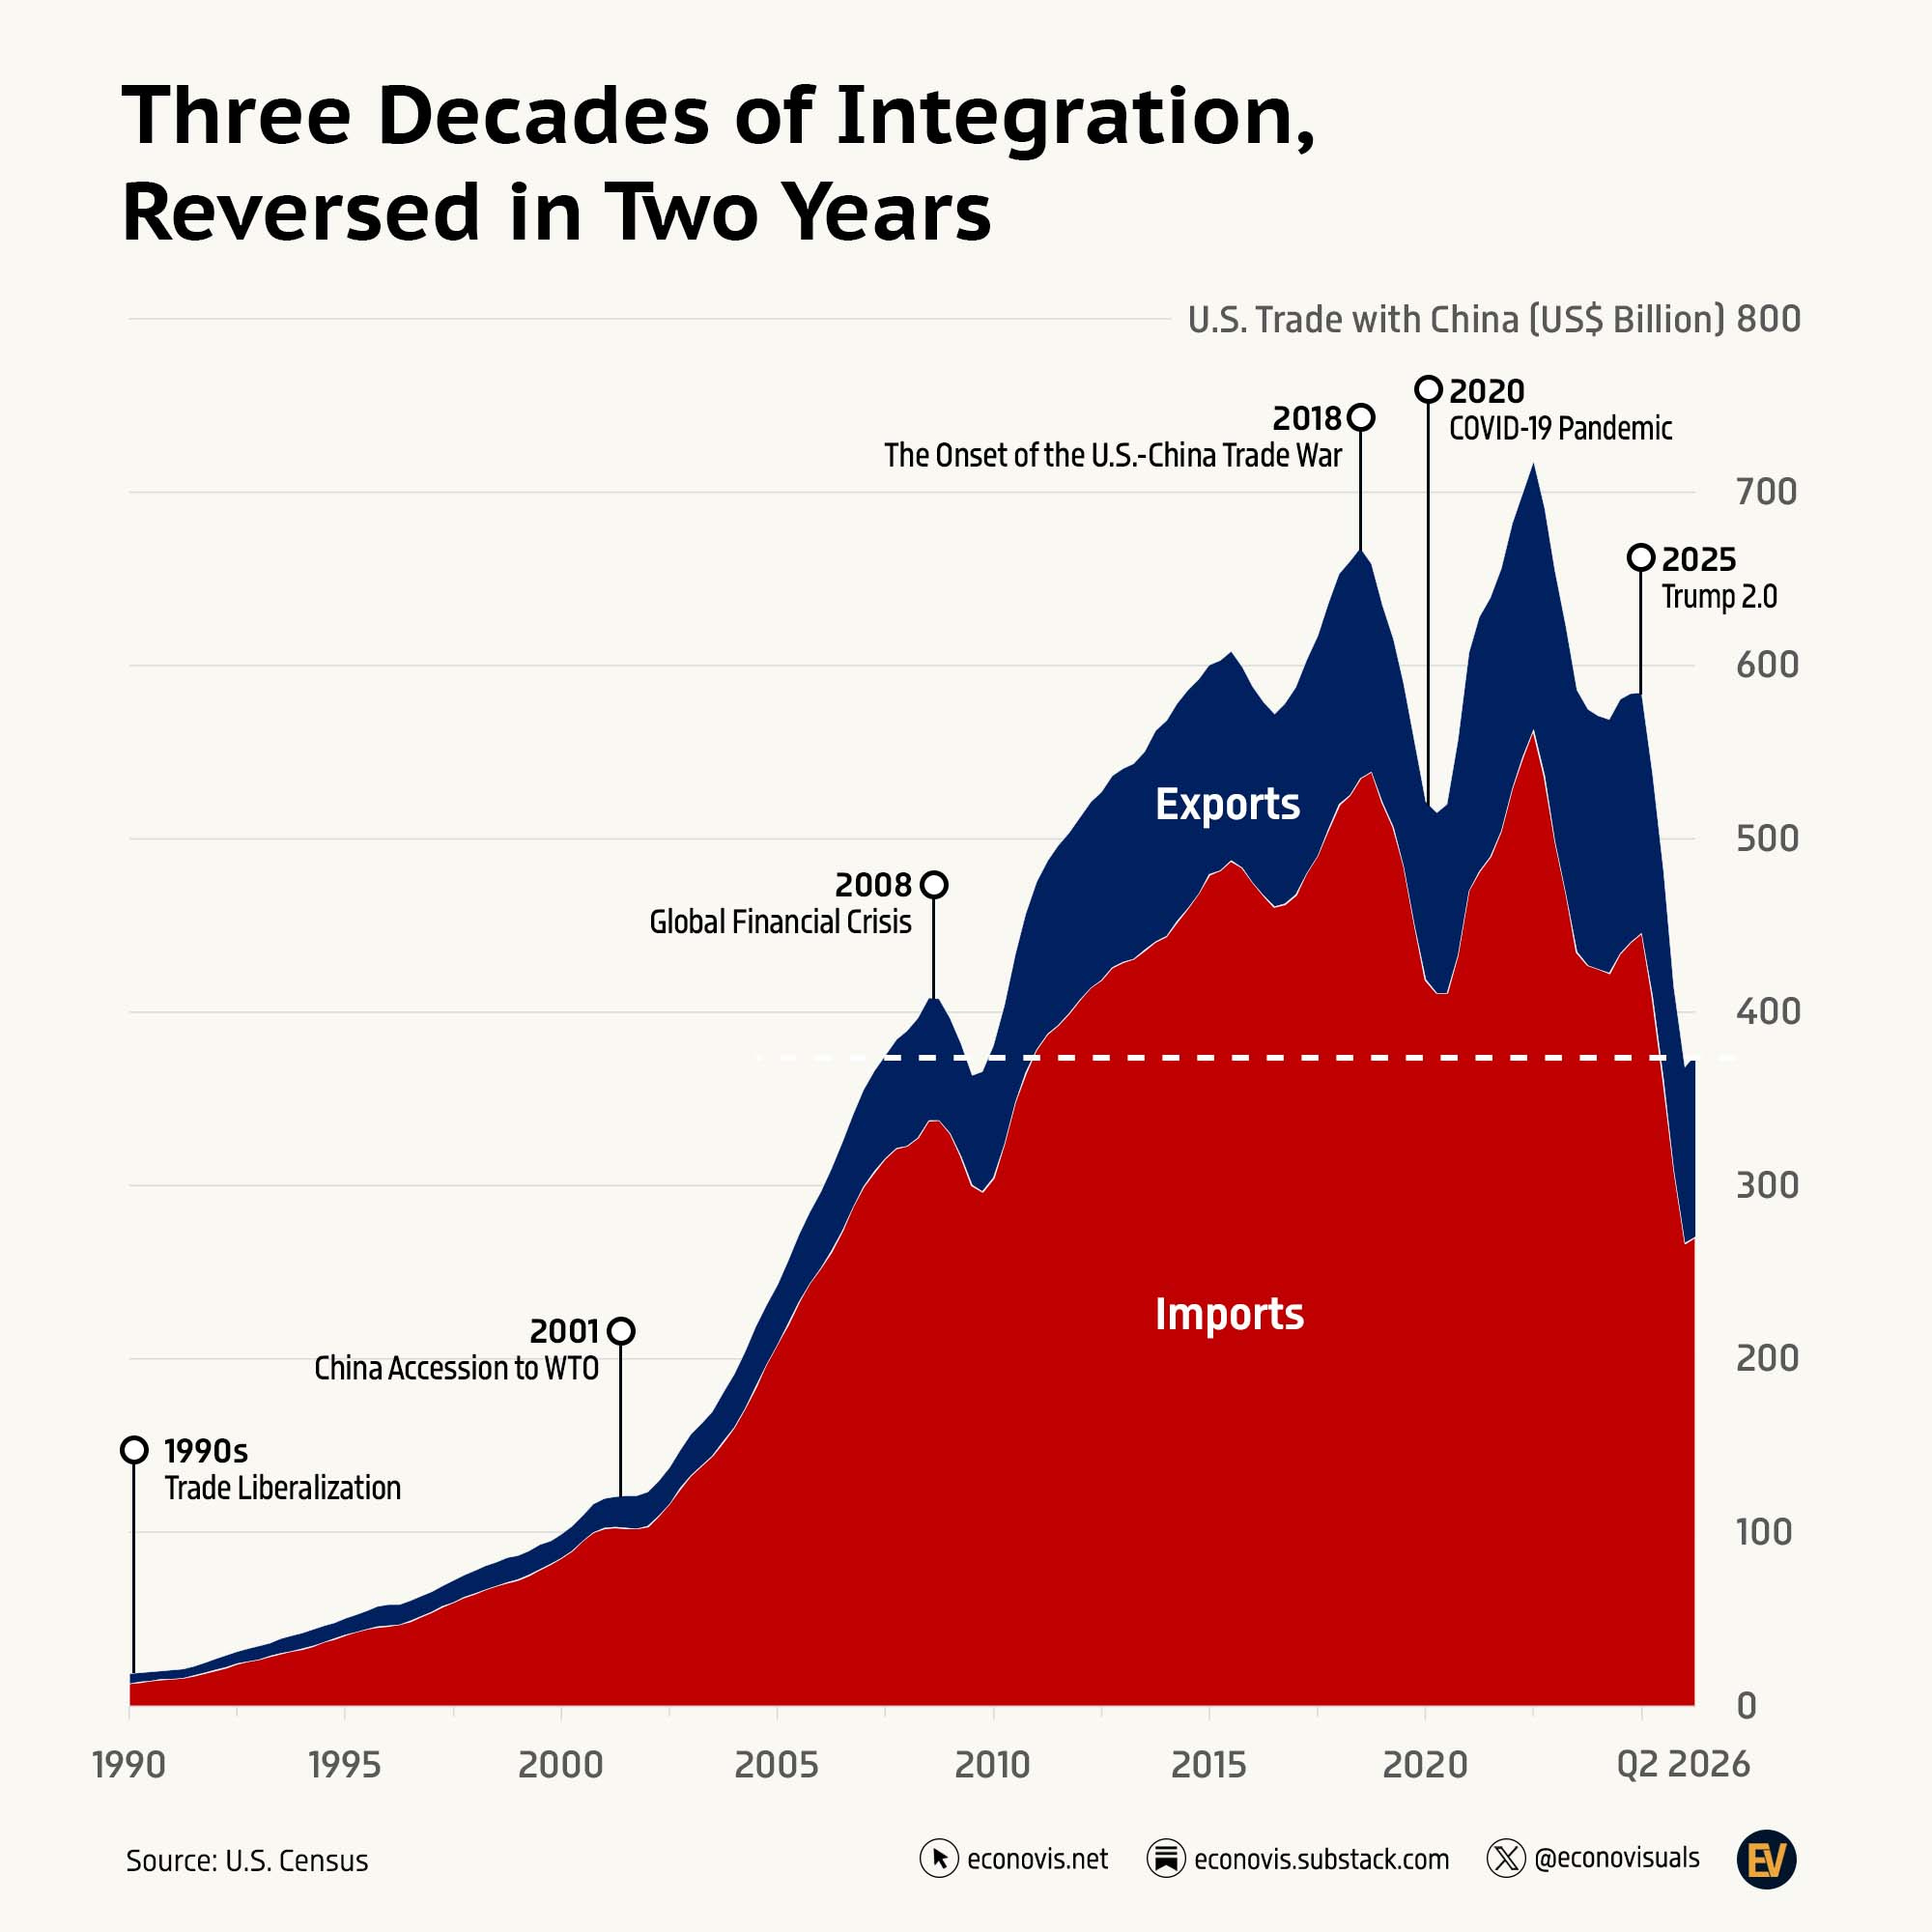
Three Decades of Integration, Reversed in Two Years
From just $20 billion in 1990, U.S.-China trade grew nearly 40-fold to a record $718 billion in 2023, weathering the Global Financial Crisis and even the initial 2018 trade war largely intact. Imports continued to rise despite successive rounds of tariffs.
That resilience has now broken. By Q2 2026, combined U.S.-China trade had fallen to roughly $376 billion, with imports down nearly half from their 2023 peak of $563 billion and exports falling to $106 billion—the steepest and most sustained pullback in the relationship’s history.
While the 2018 trade war slowed the growth of bilateral trade, the second Trump administration’s tariffs have coincided with a much sharper contraction, reversing years of expanding trade between the world’s two largest economies.
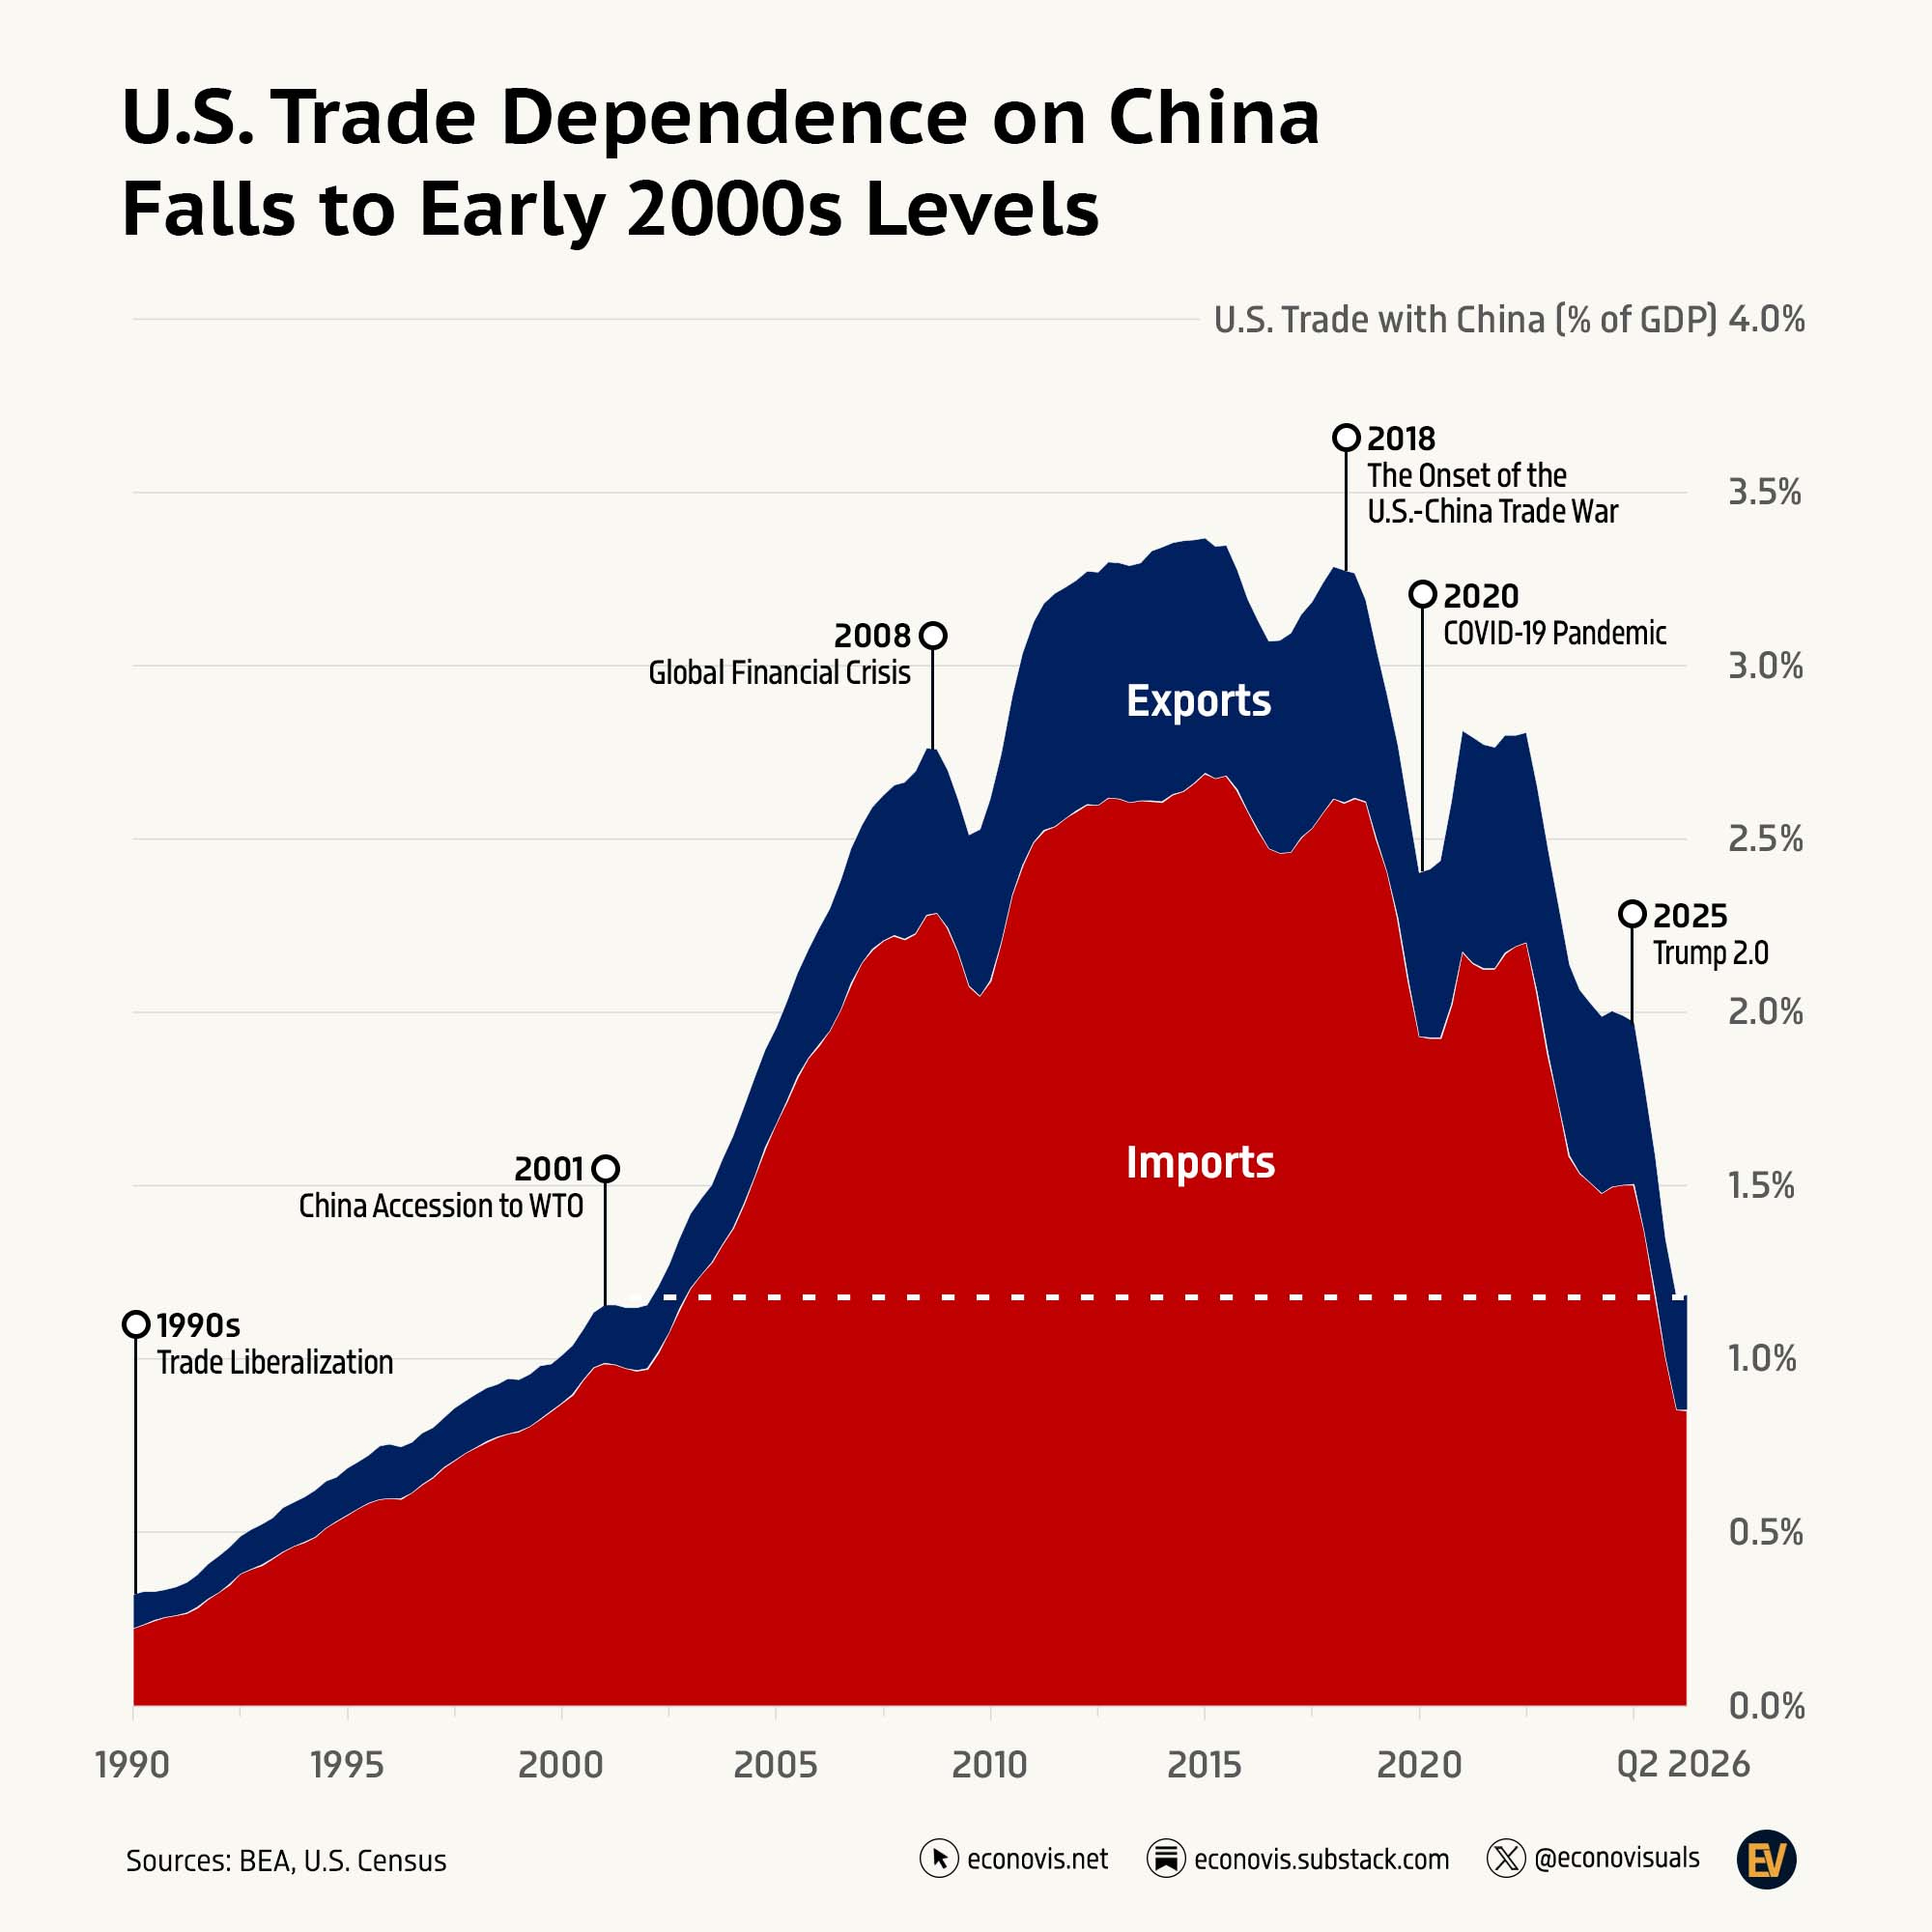
U.S. Trade Dependence on China Falls to Early-2000s Levels
U.S. trade with China as a share of GDP rose steadily from the 1980s, reaching a peak of 3.4% in the mid-2010s before declining sharply after the U.S.–China trade war began in 2018.
By Q2 2026, trade with China had fallen to 1.2% of U.S. GDP, comprising 0.9% in imports and 0.3% in exports. That brought the overall trade relationship back to levels last seen in the early 2000s.
The decline reflects a combination of supply-chain diversification, higher tariffs, and a broader reorientation of U.S. trade away from China.
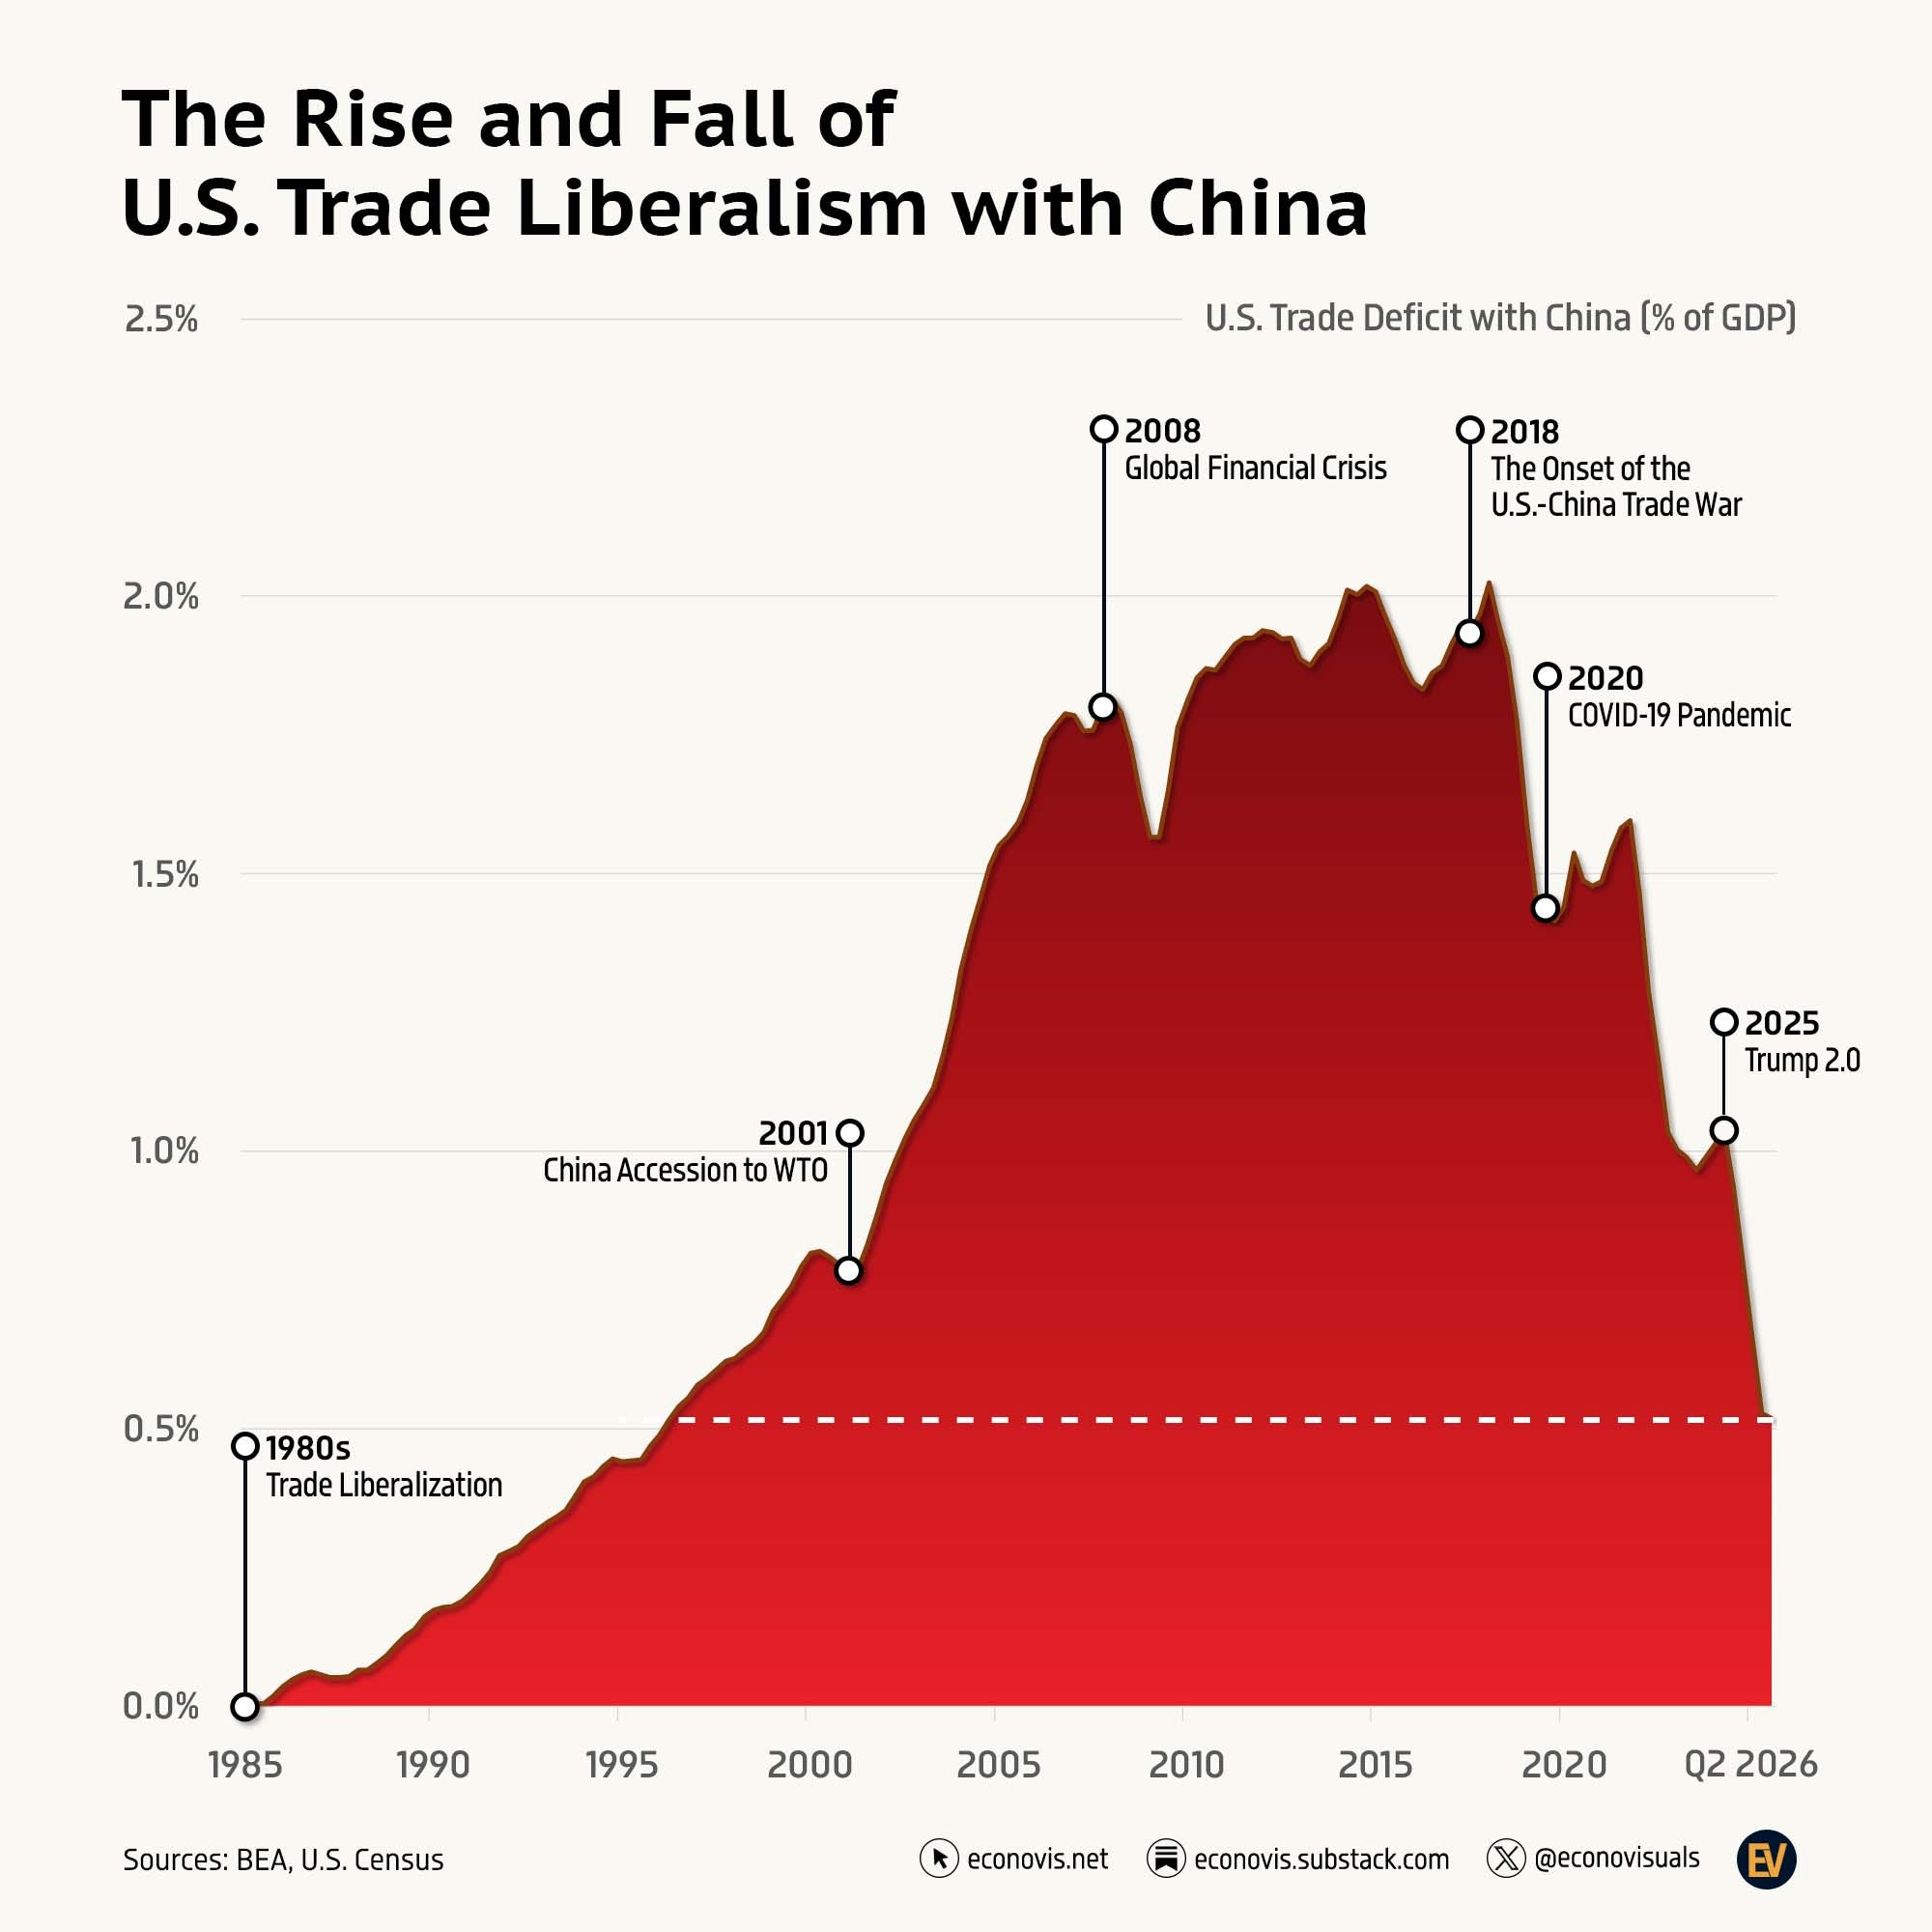
The Rise and Fall of U.S. Trade Integration with China
The U.S. goods trade deficit with China, measured as a share of GDP, rose steadily from the 1980s, accelerated after the late 1990s, and reached historically elevated levels in the late 2000s and again in the late 2010s. Since 2018, however, the deficit has declined substantially.
By Q2 2026, the U.S. goods trade deficit with China had fallen to 0.5% of GDP, its lowest level since the late 1990s.
Several major milestones mark the evolution of U.S.–China trade relations:
· 1980s — Trade Liberalization: U.S.–China trade expanded rapidly following the normalization of economic relations and the gradual opening of bilateral trade.
· 2001 — China Joins the WTO: China became a WTO member on December 11, 2001, accelerating its integration into the global trading system.
· 2008 — Global Financial Crisis: The U.S.–China trade imbalance remained near historically elevated levels even as the global financial crisis triggered a sharp contraction in international trade.
· 2018 — U.S.–China Trade War: The United States imposed successive tariffs on Chinese imports, followed by Chinese retaliatory measures, marking a major shift toward a more restrictive bilateral trade relationship.
· 2025 — Renewed Tariff Escalation: A new round of U.S. tariff measures further intensified trade tensions, while the U.S. goods trade deficit with China fell to about $203 billion, its lowest level since the mid-2000s.
U.S. Trade Deficit Realigns: China Down 61%, Rest of World Up 97% (2018–Q2 2026)
The U.S.–China trade war coincided with a lasting shift in the composition of the U.S. trade deficit. In 2015, the U.S. deficits with China and the rest of the world were roughly equal and had moved broadly in tandem. After tariffs and trade restrictions were introduced in 2018, the two trends diverged sharply.
Between 2018 and Q2 2026, the total U.S. trade deficit increased 21%, from $870 billion to $1.05 trillion. Over the same period, the deficit with China fell 61%, from $420 billion to $165 billion, while the deficit with the rest of the world surged 97%, from $450 billion to $890 billion.
By Q2 2026, the U.S. trade deficit with the rest of the world was more than five times larger than the deficit with China. The shift highlights how dramatically the geographic composition of the U.S. trade deficit has changed as trade with China has contracted and alternative trading partners have gained importance.
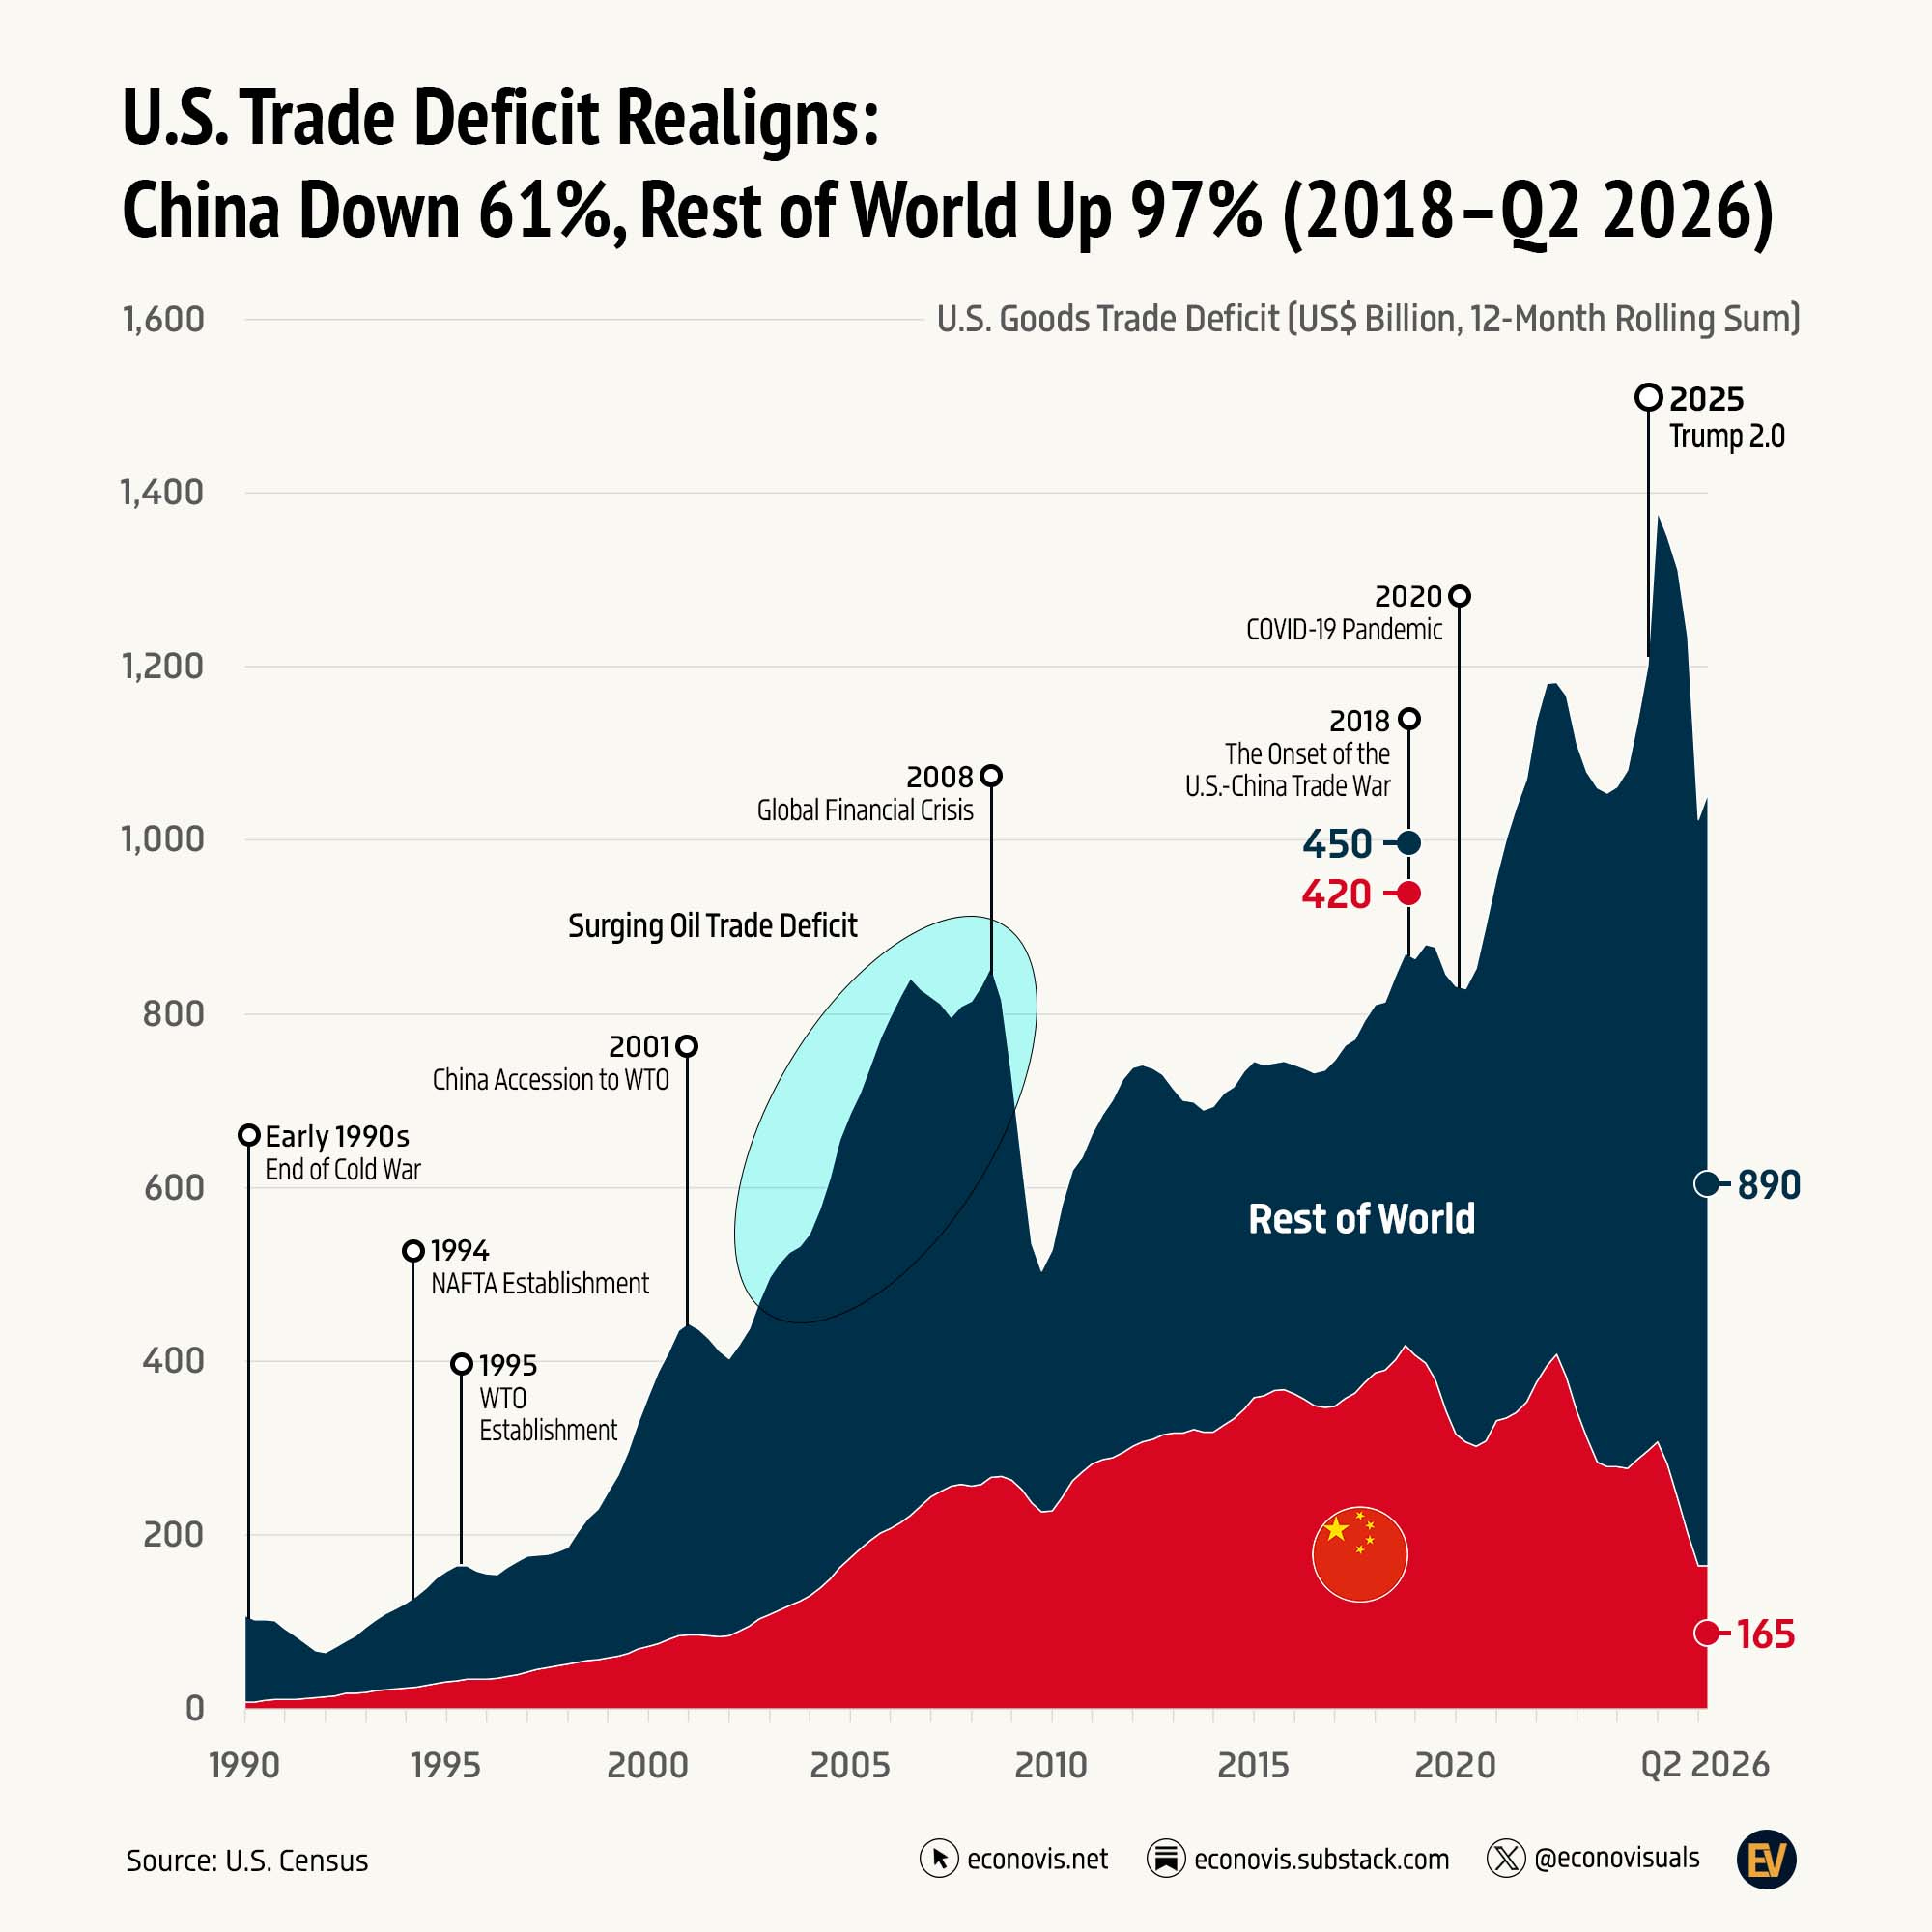
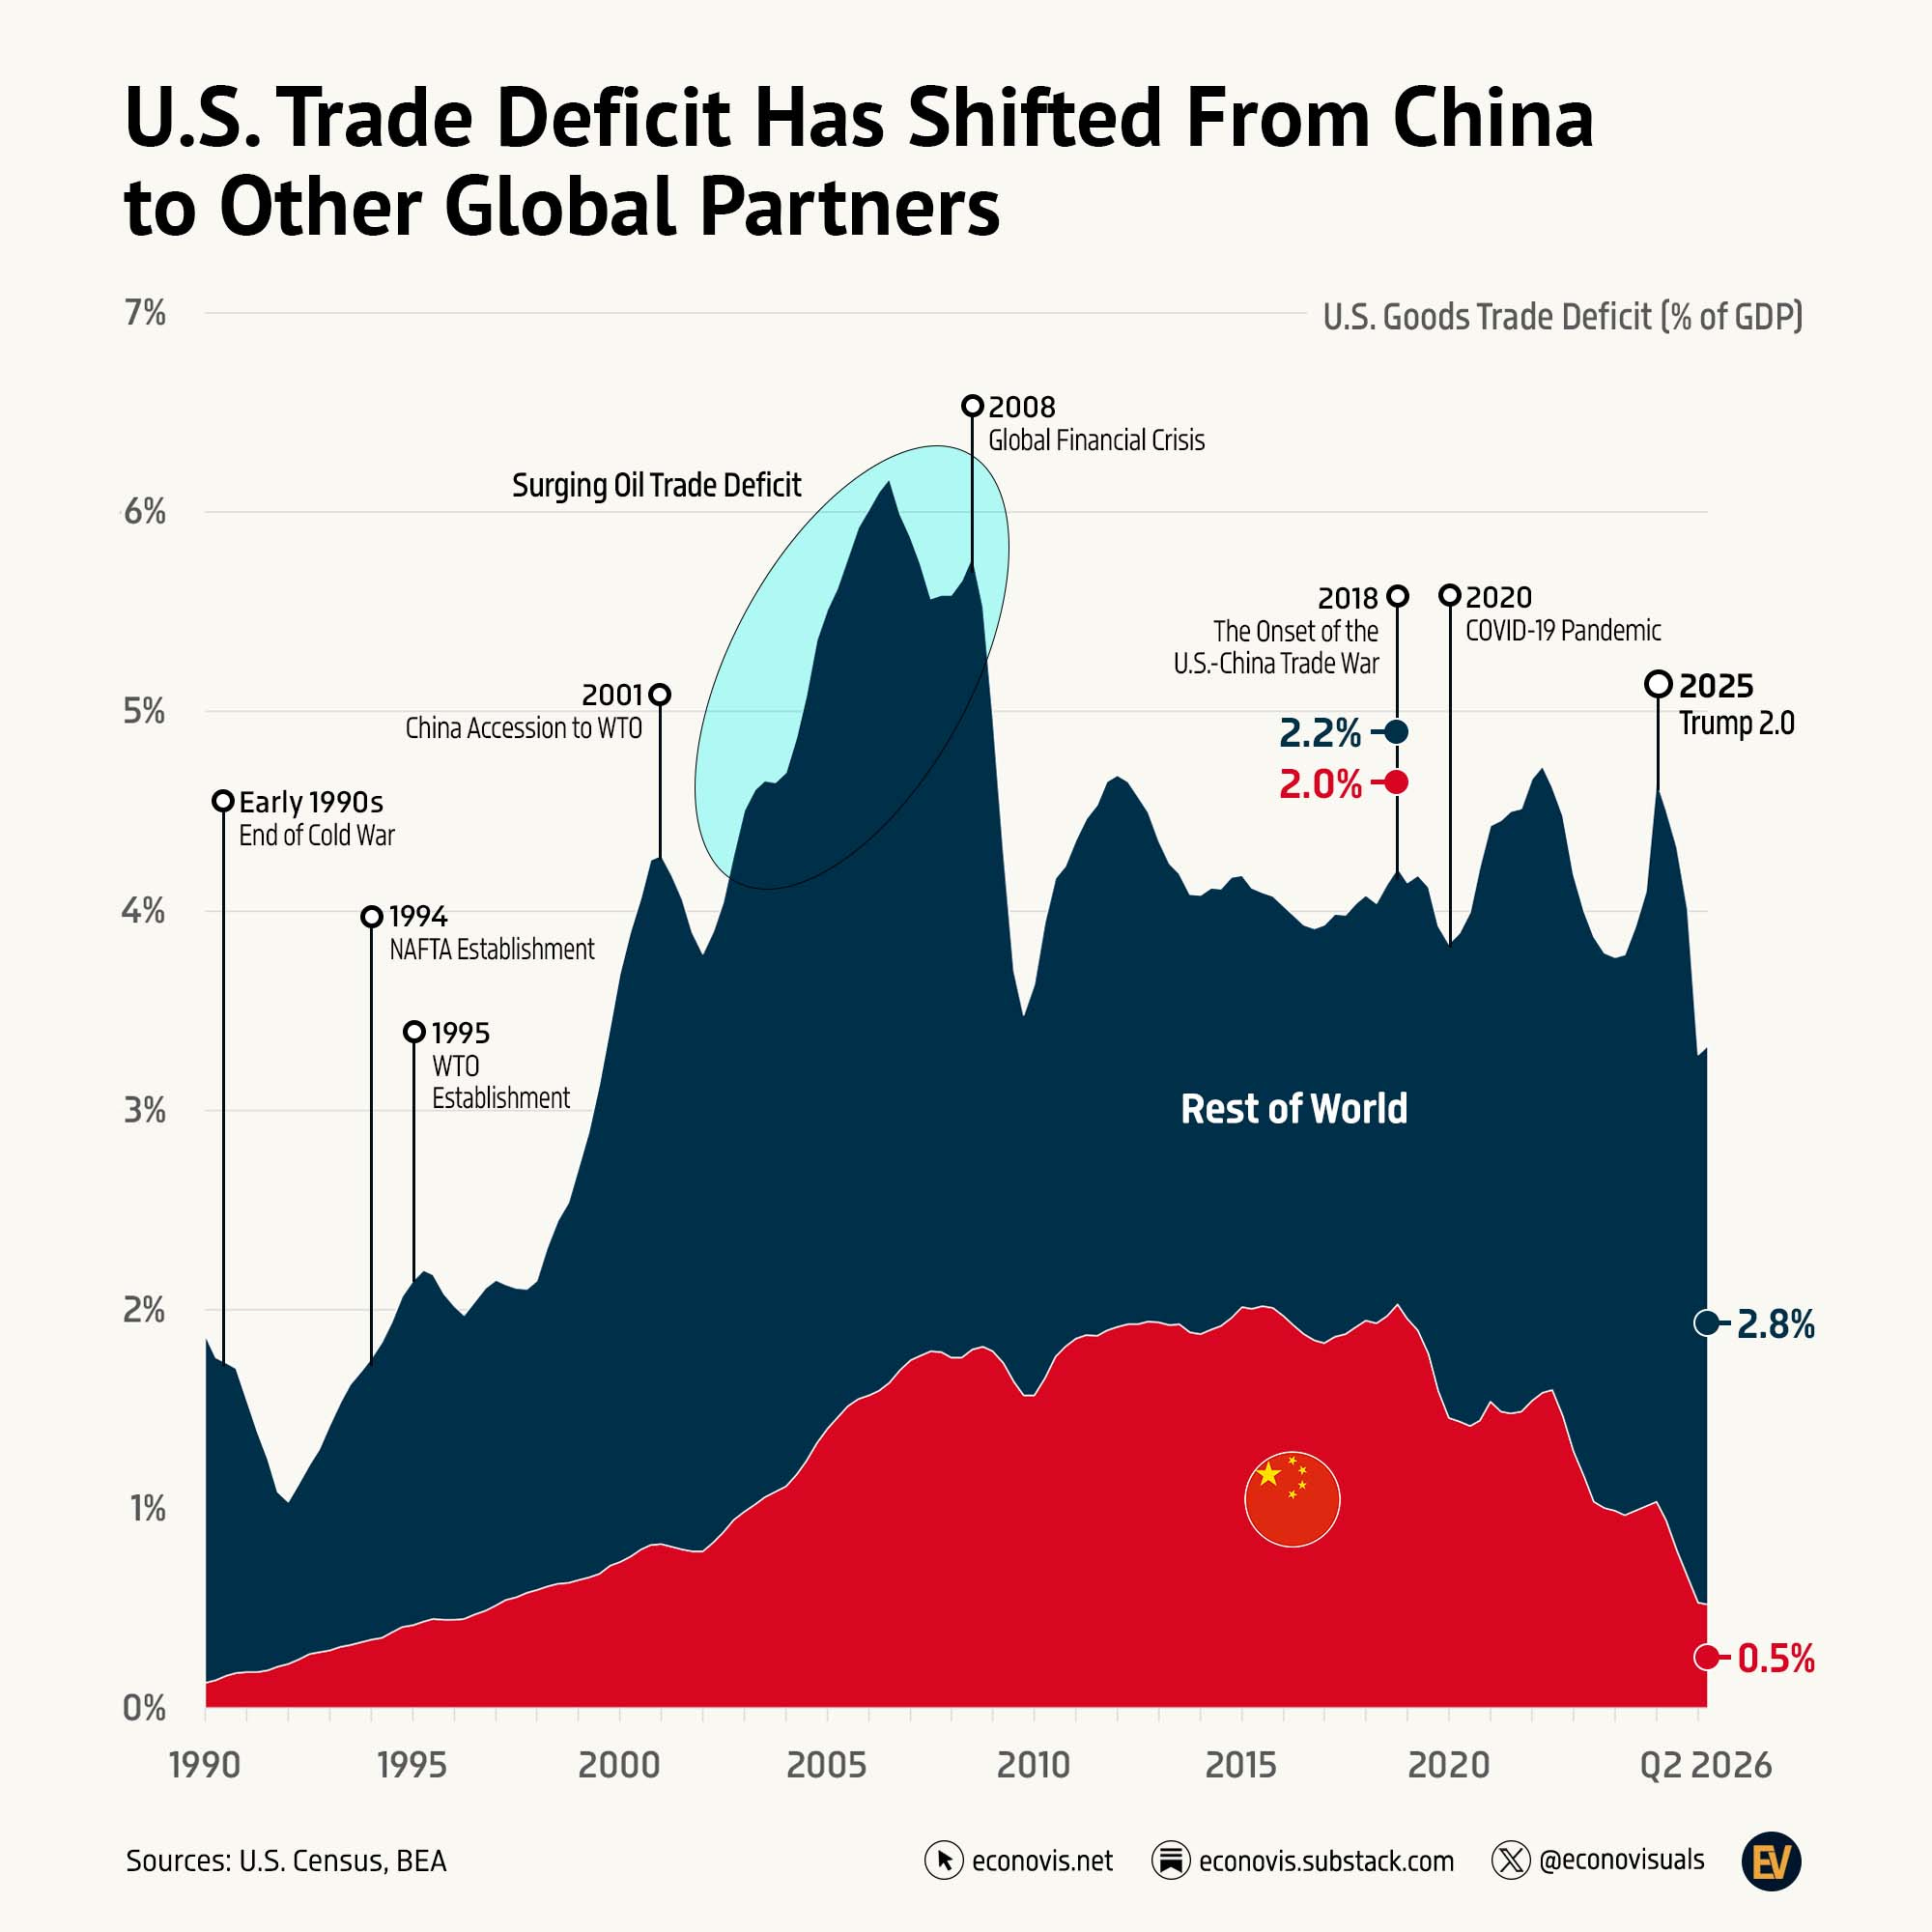
U.S. Trade Deficit Has Shifted From China to Other Global Partners
The U.S. goods trade deficit has moved through oil shocks, the Global Financial Crisis, and the pandemic, but its overall size has changed less than its geographic composition. Since the U.S.–China trade war began in 2018, China’s share of the U.S. goods trade deficit has declined substantially, while the deficit with the rest of the world has widened.
Between Q3 2018 and Q2 2026, the U.S. goods trade deficit with China fell from 2.0% to 0.5% of GDP, while the deficit with the rest of the world increased from 2.2% to 2.8%.
The divergence is consistent with a significant shift in U.S. sourcing toward other trading partners, including Vietnam, Mexico, and other manufacturing hubs, as companies adjusted supply chains amid tariffs and changing trade policies.